Deploy an observability stack for your LangSmith deployment
This section is only applicable for Kubernetes deployments.
LangSmith applications expose telemetry data that can be sent to the backend of your choice. If you don’t already have an observability stack, or prefer to keep LangSmith telemetry separate from your main application, you can use the LangSmith Observability Helm chart to deploy an end-to-end observability stack.
Section 1: Prometheus Exporters
Use this section if you would like to only deploy metrics exporters for the components in your self hosted deployment, which you can then scrape using your telemetry. If you would like a full observability stack deployed for you, go to the End-to-End Deployment section.
The helm chart provides a set of Prometheus exporters to expose metrics from Redis, Postgres, Nginx, and Kube state metrics.
- Use the file from here (ADD LINK) for your config, and modify the values as you see fit.
- Find the latest version of the chart by running
helm search repo langchain/langsmith-observability --versions. - Grab the latest version number, and run
helm install langsmith-observability langchain/langsmith-observability --values langsmith_obs_config.yaml --version <version> -n namespace --debug
This will allow you to scrape metrics at the following service endpoints:
- Postgres:
langsmith-observability-postgresexporter:9187/metrics - Redis:
langsmith-observability-redisexporter:9121/metrics - Nginx:
langsmith-observability-nginxexporter:9113/metrics - KubeStateMetrics:
langsmith-observability-kubestatemetrics:8080/metrics
Section 2: End-to-End Deployment
This section will show you how to deploy the end-to-end observability stack for LangSmith, using the Helm chart (LINK HERE).
This helm chart is built around the open-source LGTM Stack from Grafana. It consists of:
As well as OpenTelemetry Collectors for gathering the telemetry data.
Prerequisites
1. Compute Resources
Make sure you have enough resources to handle the LGTM stack. The minimum requirements stated are:
- Loki: 3 nodes for the EKS cluster, with size depending on workload. More info here
- Mimir: 1 node with 4 vCPU and 16GiB RAM
- Tempo: Size depending on data ingest. More info here
2. Cert-Manager
The helm chart uses the OpenTelemetry Operator to provision collectors. The operator require that you have cert-manager installed in your Kubernetes cluster.
If you do not have it installed, you can run the following commands:
helm repo add jetstack https://charts.jetstack.io
helm repo update
helm install cert-manager jetstack/cert-manager -n cert-manager --create-namespace
3. OpenTelemetry Operator
Use the following to install the OpenTelemetry Operator:
helm repo add open-telemetry https://open-telemetry.github.io/opentelemetry-helm-charts
helm repo update'
helm install opentelemetry-operator open-telemetry/opentelemetry-operator -n langsmith-observability
Installation
Option 1: LGTM Stack + MinIO
This option brings up the OTel collectors, LGTM stack and uses MinIO for object storage, which is an in-cluster S3-compatible object storage.
This option should only be used in development or POC environments. You should always use external object storage in production.
In order to install this, use the configuration from the e2e-stack-minio.yaml file. INSERT LINK.
You can selectively collect logs, metrics or traces by modifying the boolean values under otelCollector in your config file.
You can also selectively bring up each respective piece of the backend (Loki, Mimir, Tempo).
Option 2: LGTM Stack + Object Storage
You should always use this option for production environments. It will store your data into external object storage. The LGTM stack supports Amazon S3, Google Cloud Storage, Azure Blob Storage and OpenStack Object Storage.
And example of required values to deploy with S3 can be found in the e2e-stack-s3.yaml file (INSERT LINK HERE). It is up to you whether to use a shared bucket for all 3 services, or separate ones.
Enable Logs and Traces in LangSmith
Once you have installed the observability helm chart, you need to set the following values in your LangSmith helm configuration file to enable collection of logs and traces:
observability:
  sidecarCollector: # This will add an annotation to your containers telling the OTEL Operator to bring up a sidecar container. Used in the LangSmith Observability helm chart.
    enabled: true
    namespace: "langsmith-observability" # Replace with your LangSmith Observability namespace.
  tracing:
    enabled: true
    endpoint: "http://langsmith-collector-gateway-collector.romain-observability.svc.cluster.local:4318/v1/traces" # Replace this with the endpoint of your trace collector. If you are using the LangSmith Observability helm chart, this will be the endpoint of the OTEL Gateway collector.
Once applied, you should see each pod in your LangSmith deployment restart with a sidecar collector.
Usage
Once everything is installed, do the following:
to get your Grafana admin password:
kubectl get secret langsmith-observability-grafana -n <your-namespace> -o jsonpath="{.data.admin-password}" | base64 --decode
Then port-forward into the langsmith-observability-grafana container at port 3000, and open your browser as localhost:3000.
Use the username admin and the password from your secret to log into Grafana.
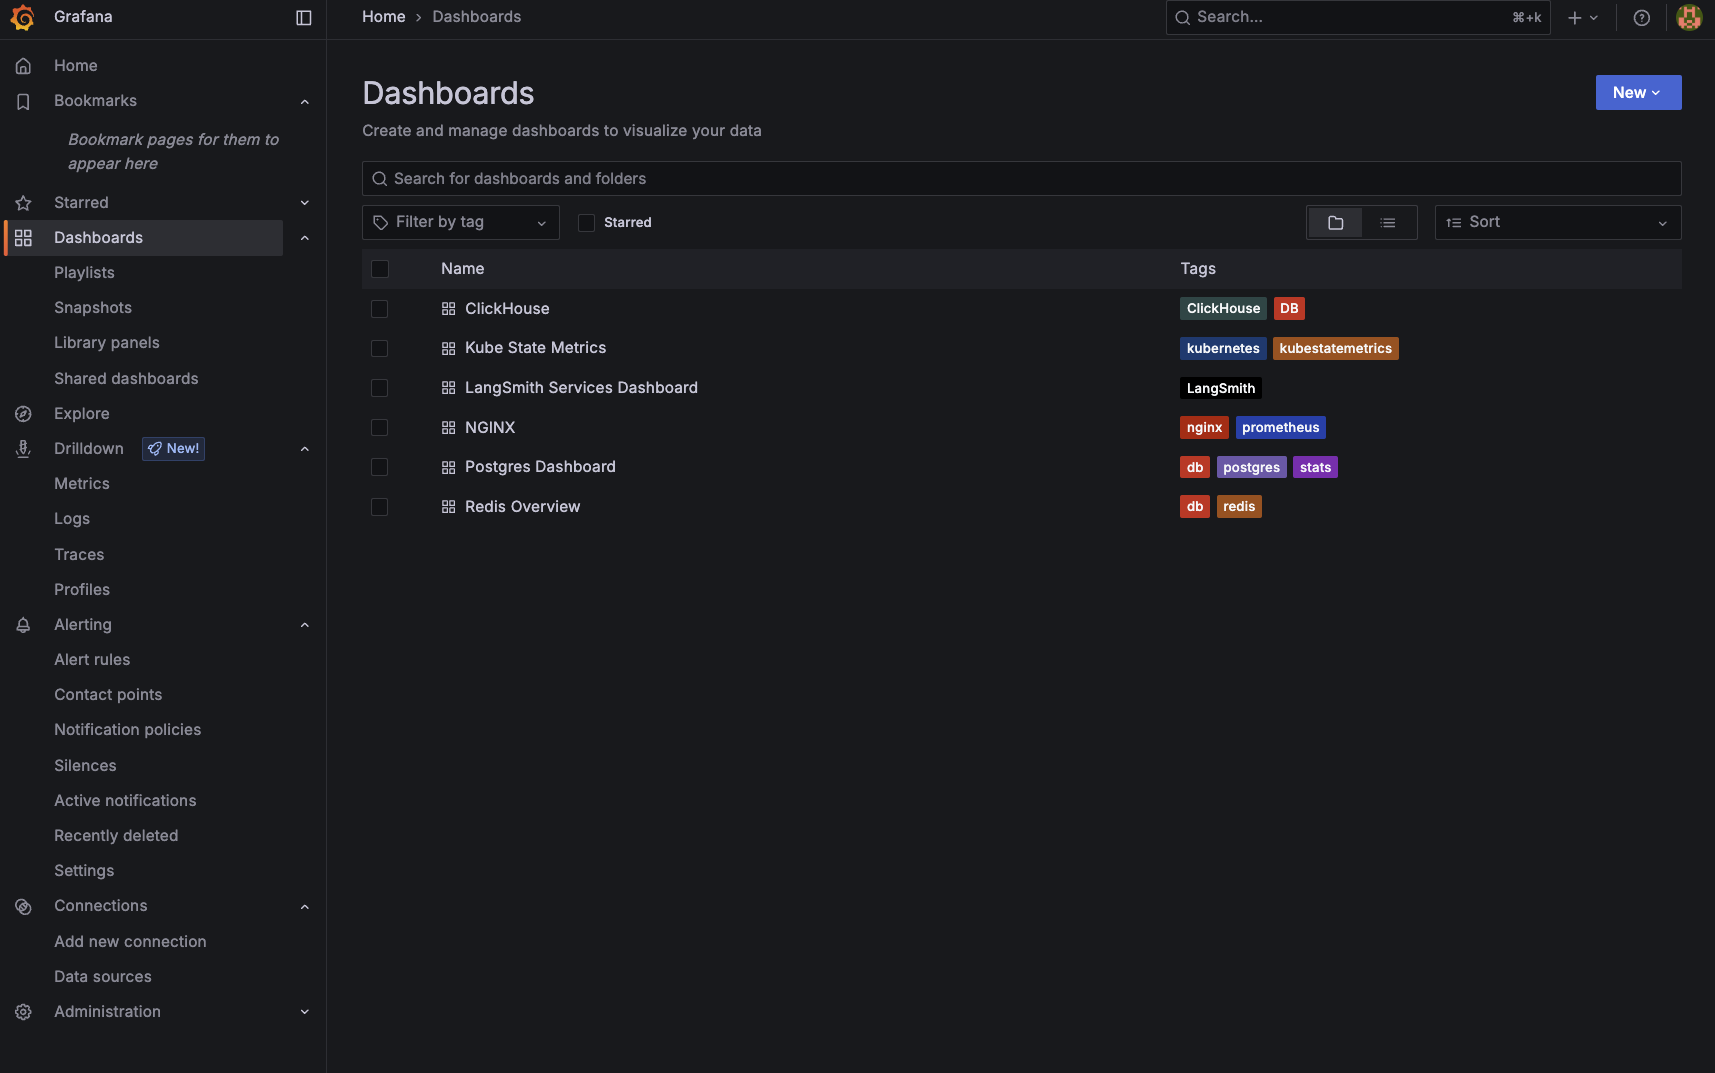
Once in Grafana, you can use the UI to monitor Logs, Metrics and Traces. Grafana also comes pre-packaged with sets of dashboards for monitoring the main components of your deployment.